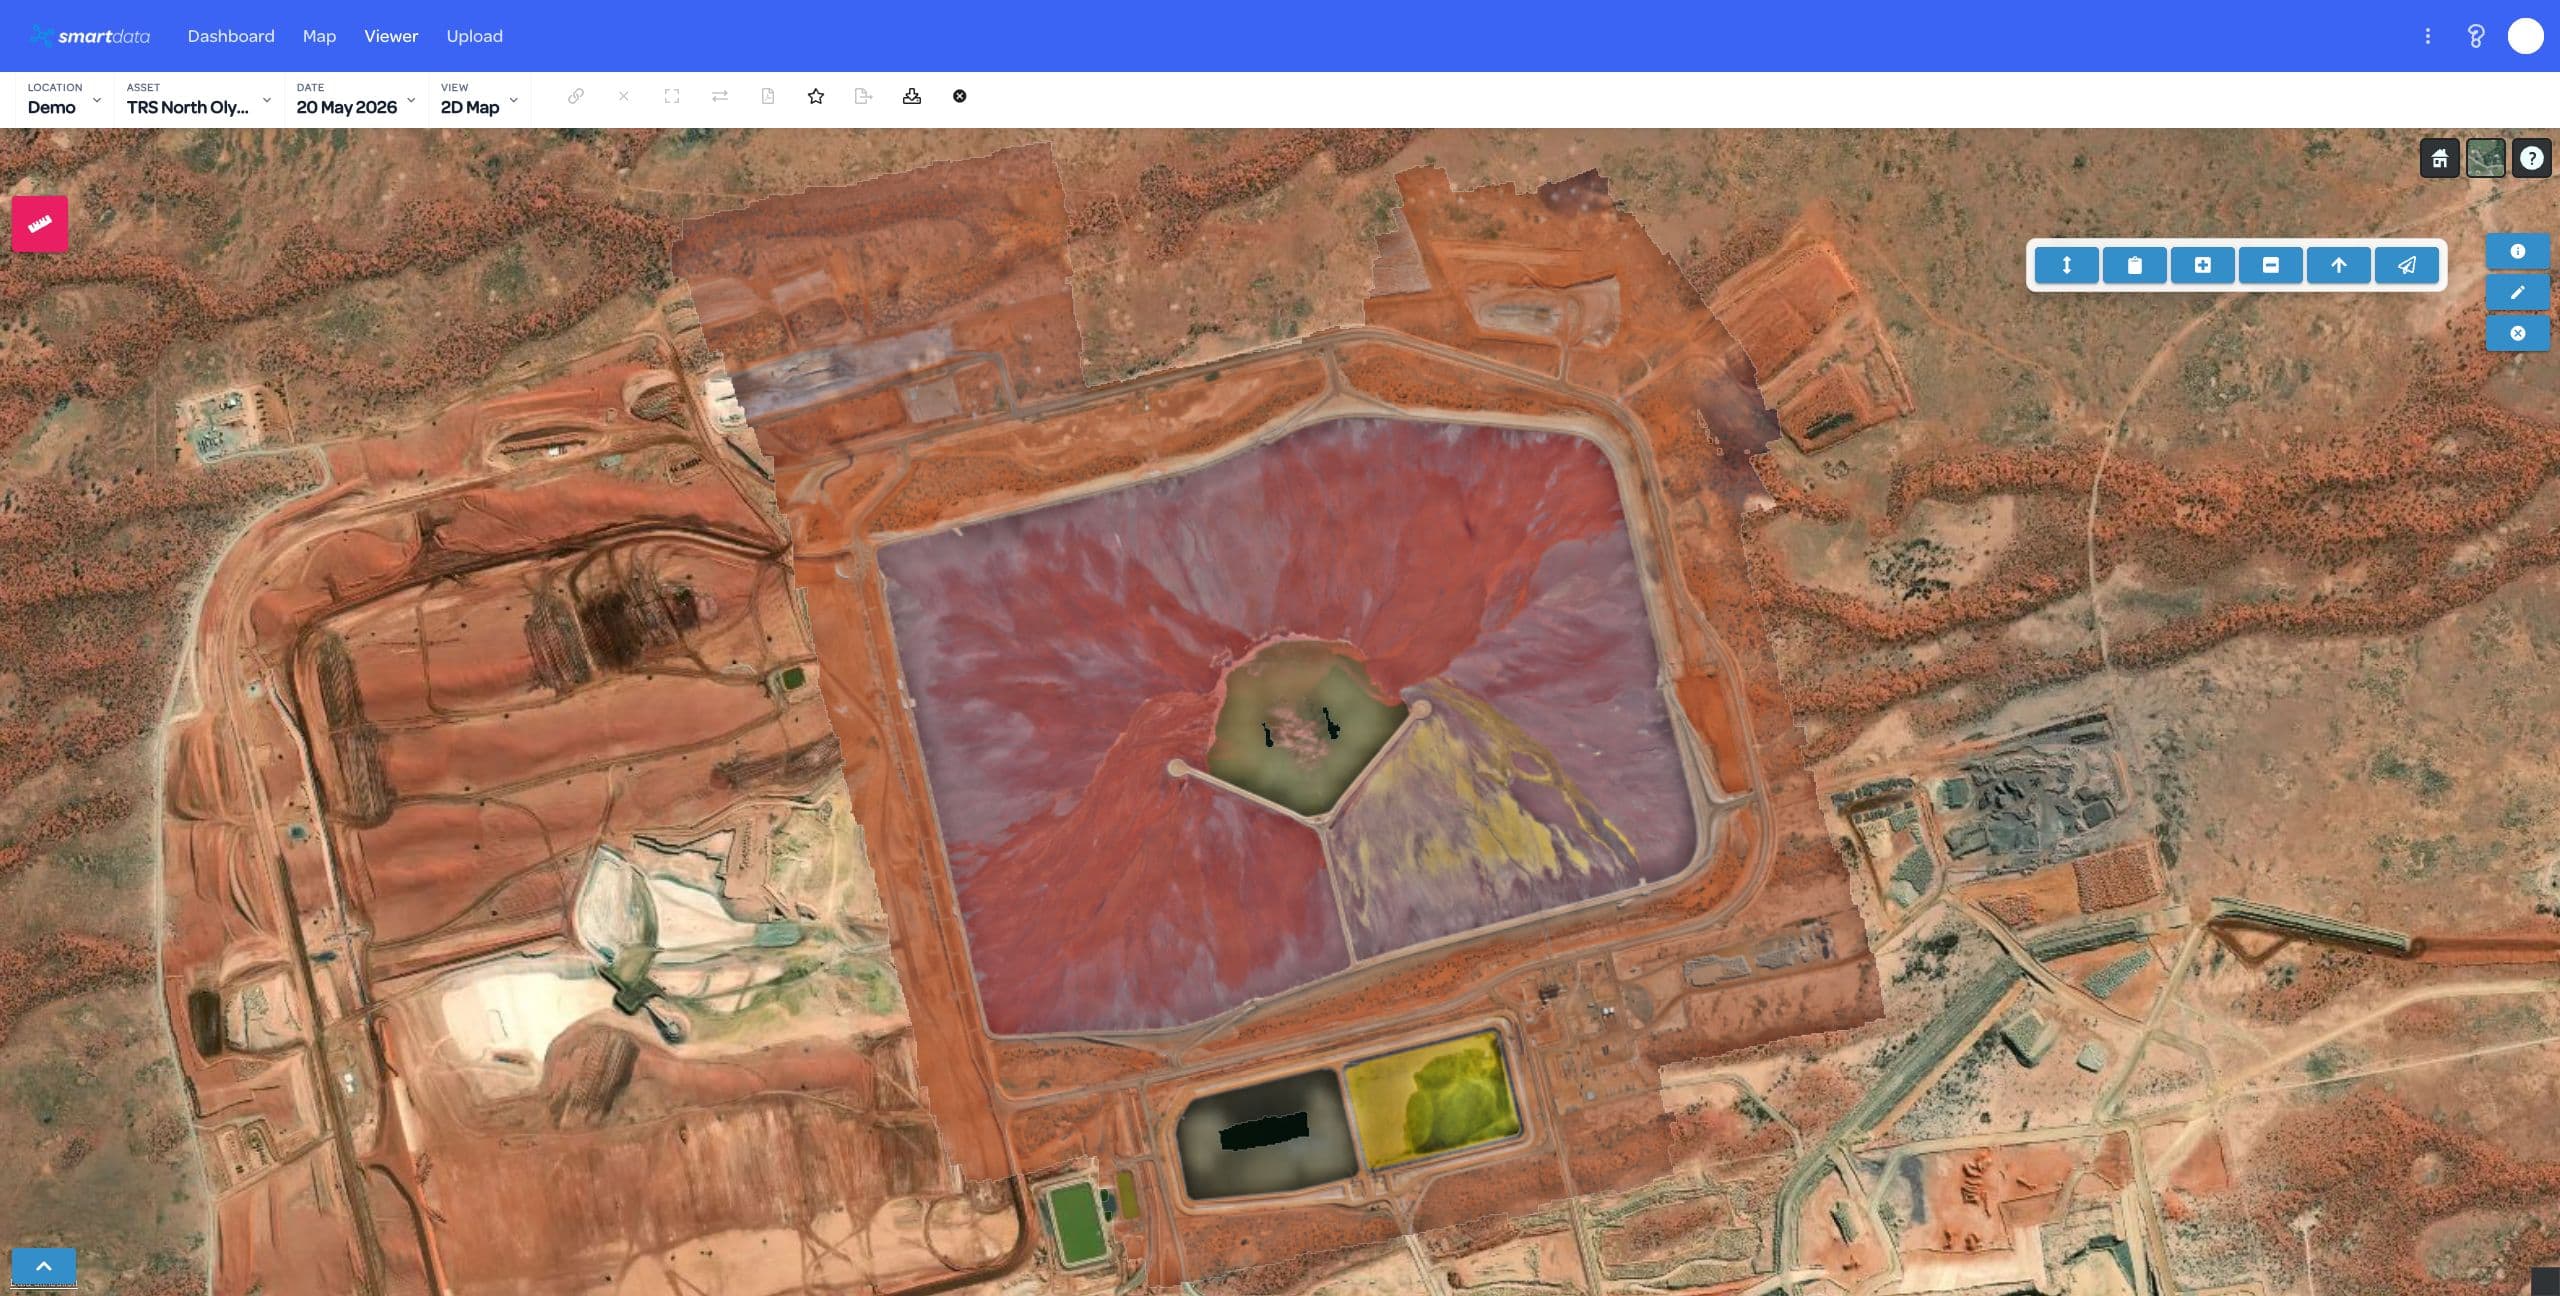
Orthomosaic Review
Explore high-resolution stitched imagery in the browser, with asset context preserved for non-GIS stakeholders.
Host orthomosaics, terrain, measurements, and annotations in a workspace built for teams that need to compare sites, prove progress, and hand off decisions.
Map detail
<3cm
Use cases
6+
Sharing
Secure
SmartData keeps the capture connected to measurement, review, and reporting. Teams can move from broad site context to a specific issue without needing everyone to be a GIS operator.
The 2D viewer is the operational layer for asset owners who need spatial context, clean evidence, and repeatable review cycles.
Explore high-resolution stitched imagery in the browser, with asset context preserved for non-GIS stakeholders.
Measure distance, area, elevation, stockpiles, and terrain change without exporting data into a separate desktop tool.
Compare current and historical datasets to understand progress, movement, encroachment, or site condition change.
Mark areas of concern, add comments, and export evidence so field teams and asset owners can act on the same view.
Support powerline, vegetation, rail, road, and linear asset review with map layers and spatially grounded inspection data.
Let stakeholders review the latest site state through a governed SmartData workspace rather than static file drops.
2D Mapping fits programs that need repeat capture, quick inspection, and evidence that can be understood across operations, engineering, and management.
Every capture follows the same practical rhythm: publish the data, make the observations, and share evidence the wider team can use.
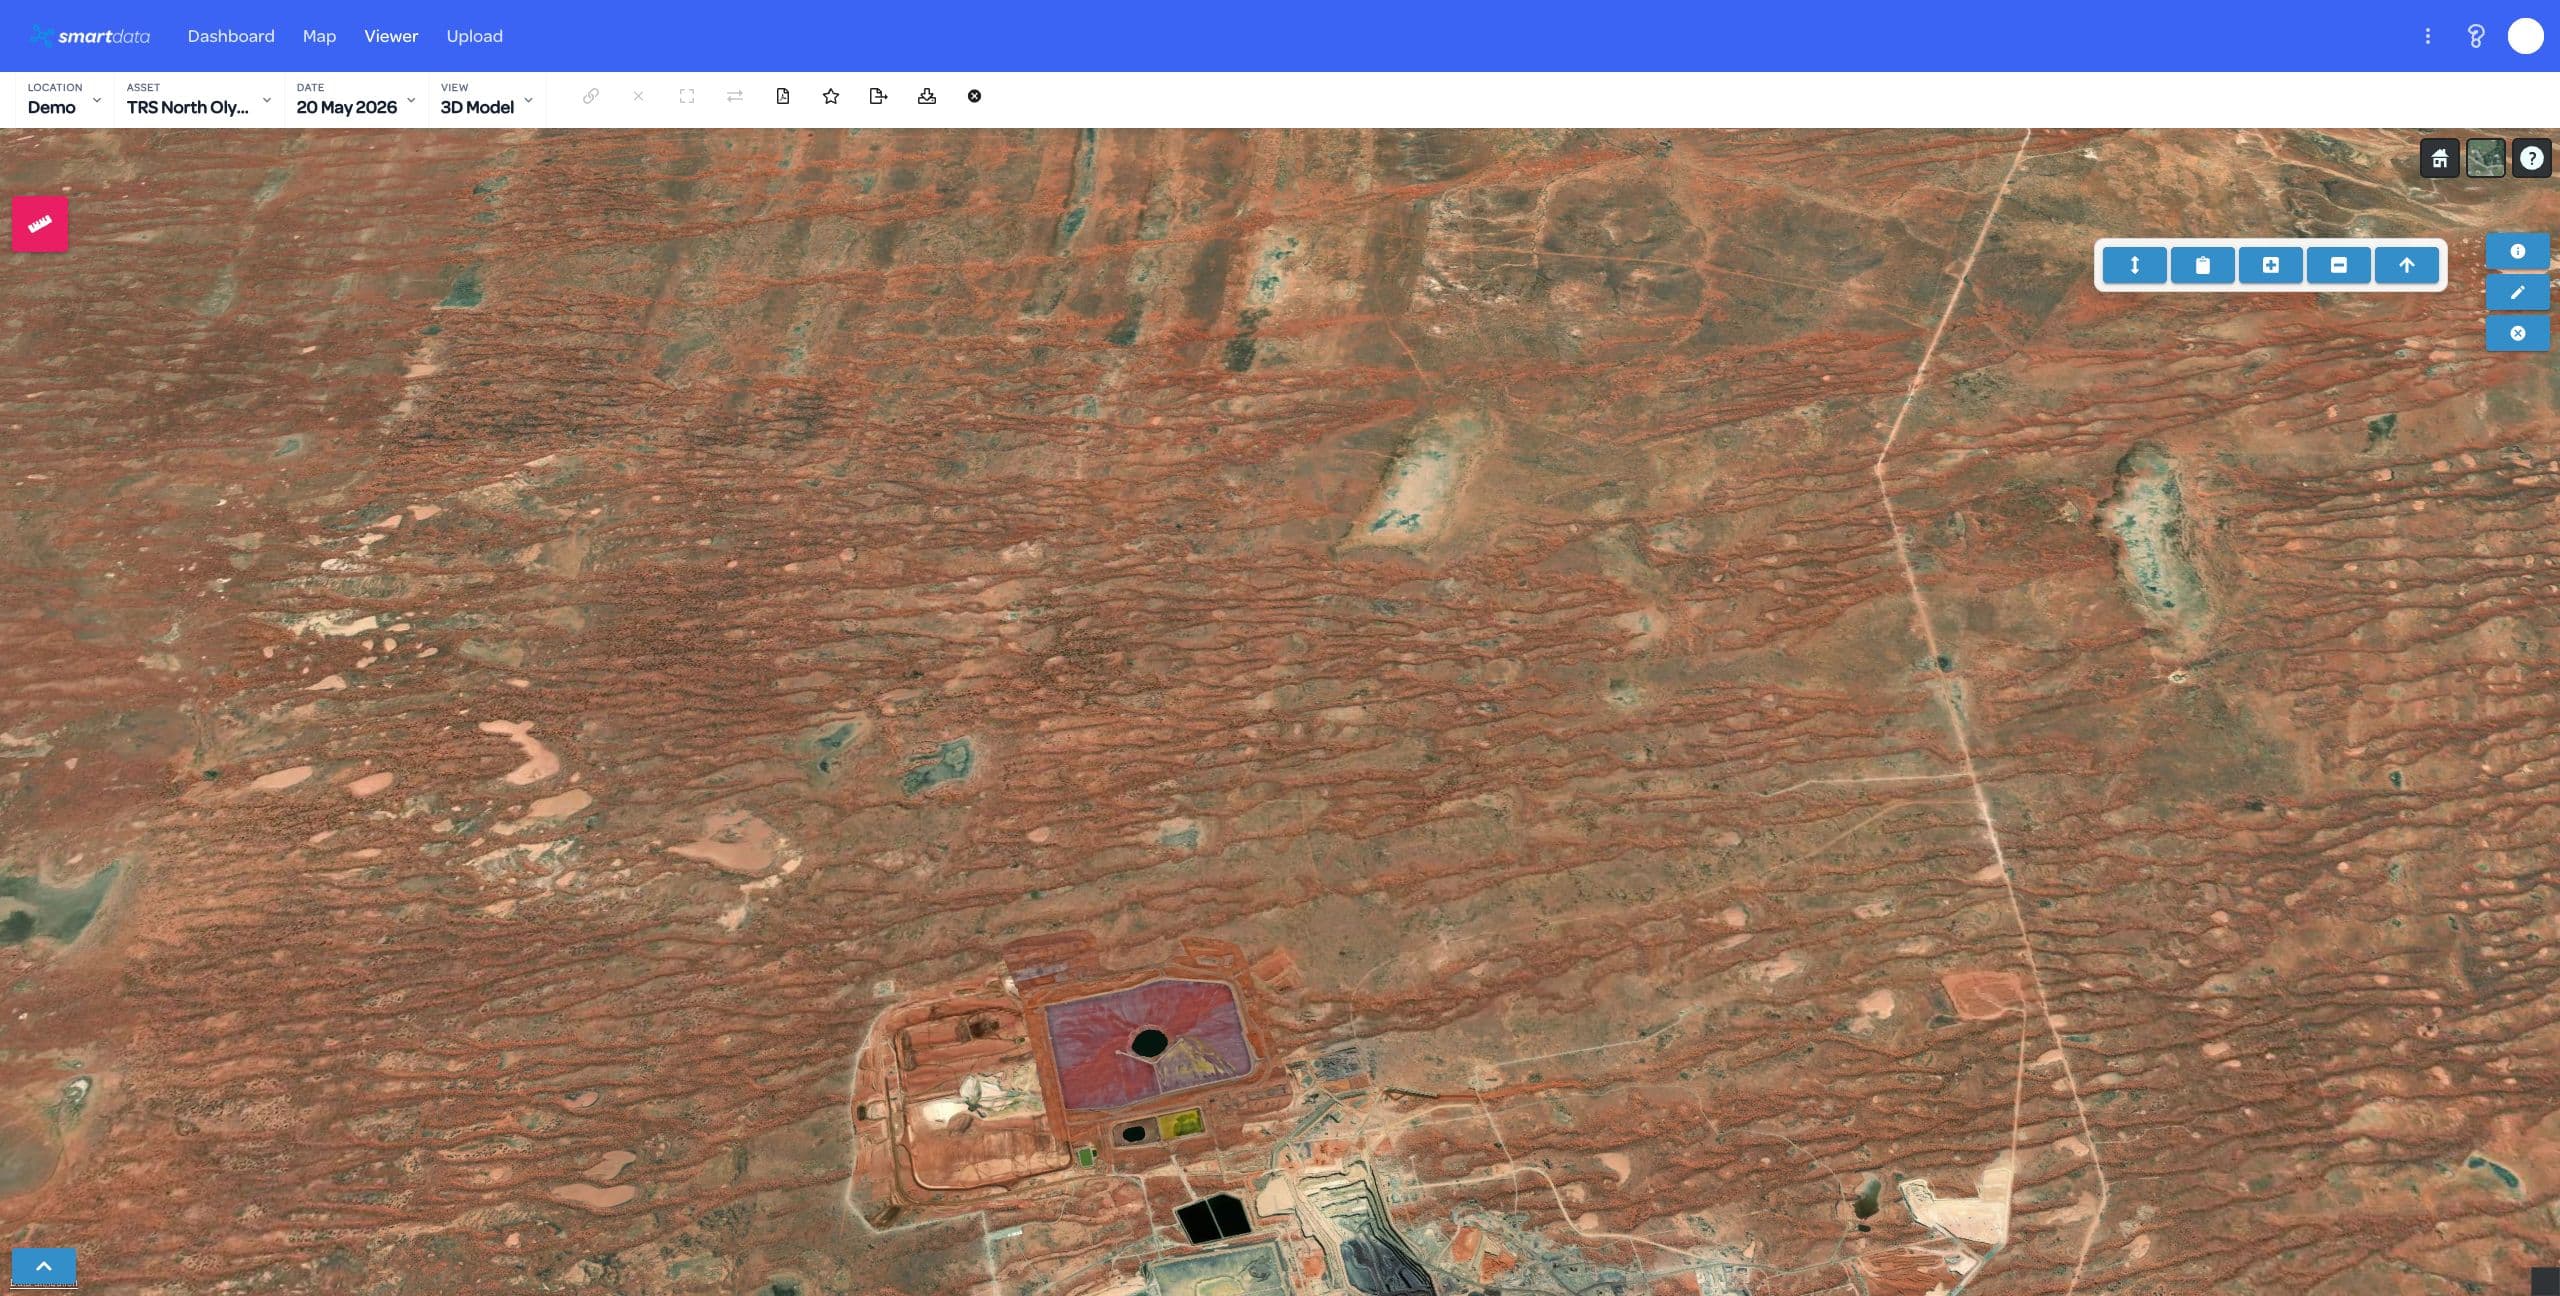
Host orthomosaics, elevation outputs, contours, and supporting layers in a single project view.
Inspect progress, terrain, vegetation, asset access, and change over time with tools built for repeat work.
Share annotated map context with the teams responsible for scheduling, maintenance, design, or compliance.
Bring a sample dataset, inspection workflow, or corridor problem. We will map the right SmartData path and show where the sandbox experience can support your own asset workflow.